High-Demand Product Finder
How This Tool Works
This interactive tool displays the top 5 high-demand product categories in 2025 based on market size, compound annual growth rate (CAGR), and key drivers. Adjust the CAGR filter to see which categories meet your minimum growth threshold, and sort by different criteria to analyze trends.
When you hear the phrase high-demand product, you’re thinking about the item that shoppers are scrambling for, retailers are stocking up on, and manufacturers are racing to produce. As of October 2025, a handful of product categories dominate the conversation because they tap into lasting consumer shifts, technology breakthroughs, and supply‑chain realities.
Quick Summary / Key Takeaways
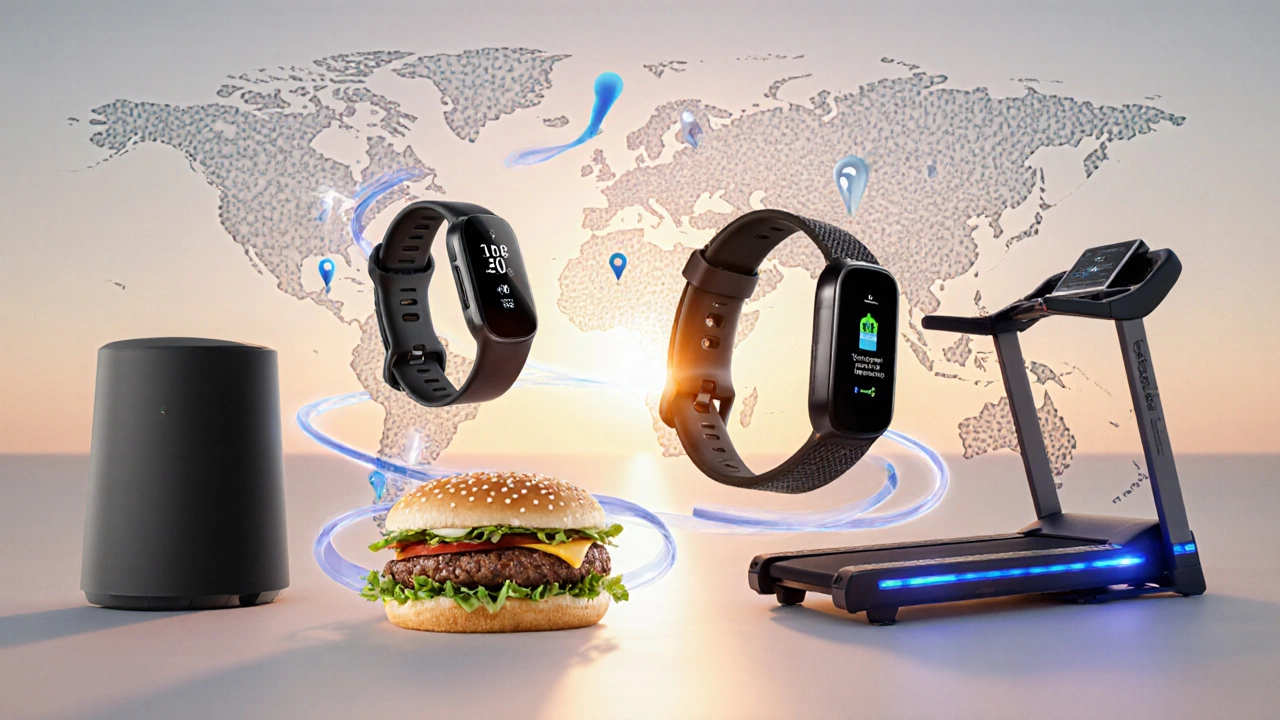
- Smart home devices, AI‑driven wearables, and electric‑vehicle batteries top the demand list.
- Health‑focused consumables like plant‑based meat and premium supplements are surging on wellness trends.
- Supply‑chain bottlenecks and inflation are shaping which products can scale quickly.
- A simple 5‑point checklist helps you spot the next demand breakout.
- Reliable data sources include trade reports, e‑commerce platform analytics, and government import/export stats.
How We Picked the Winners
To avoid guesswork, we combined three data streams:
- Global trade data: Import/export volumes from UN Comtrade and the World Bank give us a macro view of what’s moving across borders.
- Platform sales analytics: Quarterly reports from Amazon, Alibaba, and Shopify reveal top‑selling SKUs and category growth rates.
- Consumer sentiment surveys: Nielsen and Kantar pulse surveys track willingness to spend on new categories.
We filtered for products with a compound annual growth rate (CAGR) above 20% and a valuation exceeding US$10billion. The result is a concise list of categories that are not just "hot right now" but are likely to stay hot for the next 12‑18months.

Top 5 High‑Demand Product Categories in 2025
Each of these categories ticks the growth, volume, and consumer‑interest boxes. Below you’ll find a snapshot of market size, key drivers, and typical price points.
| Category | Global Market Size (US$bn) | CAGR (2022‑2025) | Key Driver | Average Price Range |
|---|---|---|---|---|
| Smart Home Devices | 85 | 28% | IoT integration + energy‑saving incentives | $30‑$300 |
| AI‑Enhanced Wearables | 42 | 32% | Health monitoring & personalized coaching | $100‑$500 |
| Electric‑Vehicle Batteries | 110 | 25% | EV adoption & government subsidies | $400‑$1,200 per kWh |
| Plant‑Based Meat Alternatives | 38 | 30% | Flexitarian diets & sustainability concerns | $5‑$12 per lb |
| Premium Home‑Fitness Equipment | 27 | 22% | Post‑pandemic health focus | $200‑$2,500 |
Why These Products Are Flying Off Shelves
Below we dive into the specific forces that push each category forward.
Smart Home Devices
From voice‑controlled speakers to energy‑monitoring thermostats, smart home gear benefits from two overlapping trends: the drop in Internet of Things (IoT) chipset costs and generous rebates offered by utility companies for energy‑saving upgrades. In the United States alone, rebates have boosted smart‑thermostat installations by 15% YoY.
AI‑Enhanced Wearables
Wearables are no longer just step counters. New models embed on‑device AI that can detect irregular heart rhythms, predict fatigue, and suggest real‑time coaching. The FDA’s recent clearance of three AI‑based health wearables has given consumers the confidence to pay a premium.
Electric‑Vehicle Batteries
EV sales hit 12million units globally in 2024, a 23% increase over 2023. Battery manufacturers that can promise a 5‑year, 150,000‑mile warranty are seeing pre‑orders that exceed production capacity, creating a classic high‑demand scenario. Government mandates in the EU and China to phase out ICE vehicles by 2035 add urgency.
Plant‑Based Meat Alternatives
Flexitarians now represent 37% of U.S. adults, according to the 2025 Nutrition Trends Survey. Brands that use pea‑protein blends achieve a 20% lower production cost than soy‑based rivals, making them attractive to both retailers and price‑sensitive shoppers.
Premium Home‑Fitness Equipment
The pandemic introduced a habit: working out at home. While gyms have reopened, many consumers keep a high‑end treadmill or smart‑bike for convenience. Subscription‑linked equipment, which streams live classes, accounts for 40% of the market’s revenue growth.
5‑Point Checklist to Spot the Next High‑Demand Product
- Rapid technology cost decline: If a component’s price drops by 30%+ within two years, related products often surge.
- Policy incentives: Watch for new subsidies, tax credits, or bans that shift consumer behavior.
- Health or sustainability buzz: Products tied to well‑being or climate goals get early adopters.
- Supply‑chain resilience: Items with diversified sourcing can scale faster when demand spikes.
- Platform data signals: Sudden jumps in search volume or “add‑to‑cart” rates on major e‑commerce sites are early red flags.
Where to Find Real‑Time Demand Data
Staying ahead means tapping the right dashboards:
- UN Comtrade - monthly import/export figures by HS code.
- Marketplace analytics - Amazon Brand Analytics, Alibaba Index, and Shopify Sales Dashboard.
- Industry reports - Gartner, IDC, and BloombergNEF for tech‑heavy categories.
- Government portals - U.S. Census trade data, EU’s Eurostat, and India’s Ministry of Commerce.
Most of these sources provide CSV exports, which you can feed into a simple Excel pivot table to spot month‑over‑month spikes.
Frequently Asked Questions
Which product category is expected to grow the fastest after 2025?
AI‑enhanced wearables are projected to maintain a CAGR above 30% through 2027, driven by continued health‑monitoring innovations and expanding insurance partnerships.
How reliable are e‑commerce platform sales figures for demand forecasting?
Platform data is highly reliable for consumer‑facing products because it captures real purchase intent, but it may under‑represent B2B‑only items. Pairing platform data with trade statistics balances the view.
Can small manufacturers tap into these high‑demand trends?
Yes, especially in niches like plant‑based snacks or custom smart‑home accessories where agility and rapid prototyping give an edge over large incumbents.
What role do sustainability certifications play in demand?
Certifications such as USDA‑Organic, EU‑Ecolabel, or B‑Corp act as trust signals. Products with these tags have seen price premiums of 10‑15% and higher repeat‑purchase rates.
How can I use the 5‑point checklist in practice?
Set up a weekly scan of news feeds, trade data releases, and platform trend reports. Score each emerging product against the checklist; a score of 4+ indicates a strong demand candidate.